@chascoadmin, @Nipul,
I was concerned about steep slopes when planning tractor usage so I took a swipe at using the exported DroneDeploy 3D model to generate a slope map. My first result, using the mesh vertex normals, came out a little psychedelic:
There are several problems compared to my elevation maps:
- The trees, which dominate the area, have very steep slopes on their sides (> 100% grade) along with flatter tops that span a wide range of slopes. The result is quite a mess.
- The buildings, while not as bad, have a similar problem.
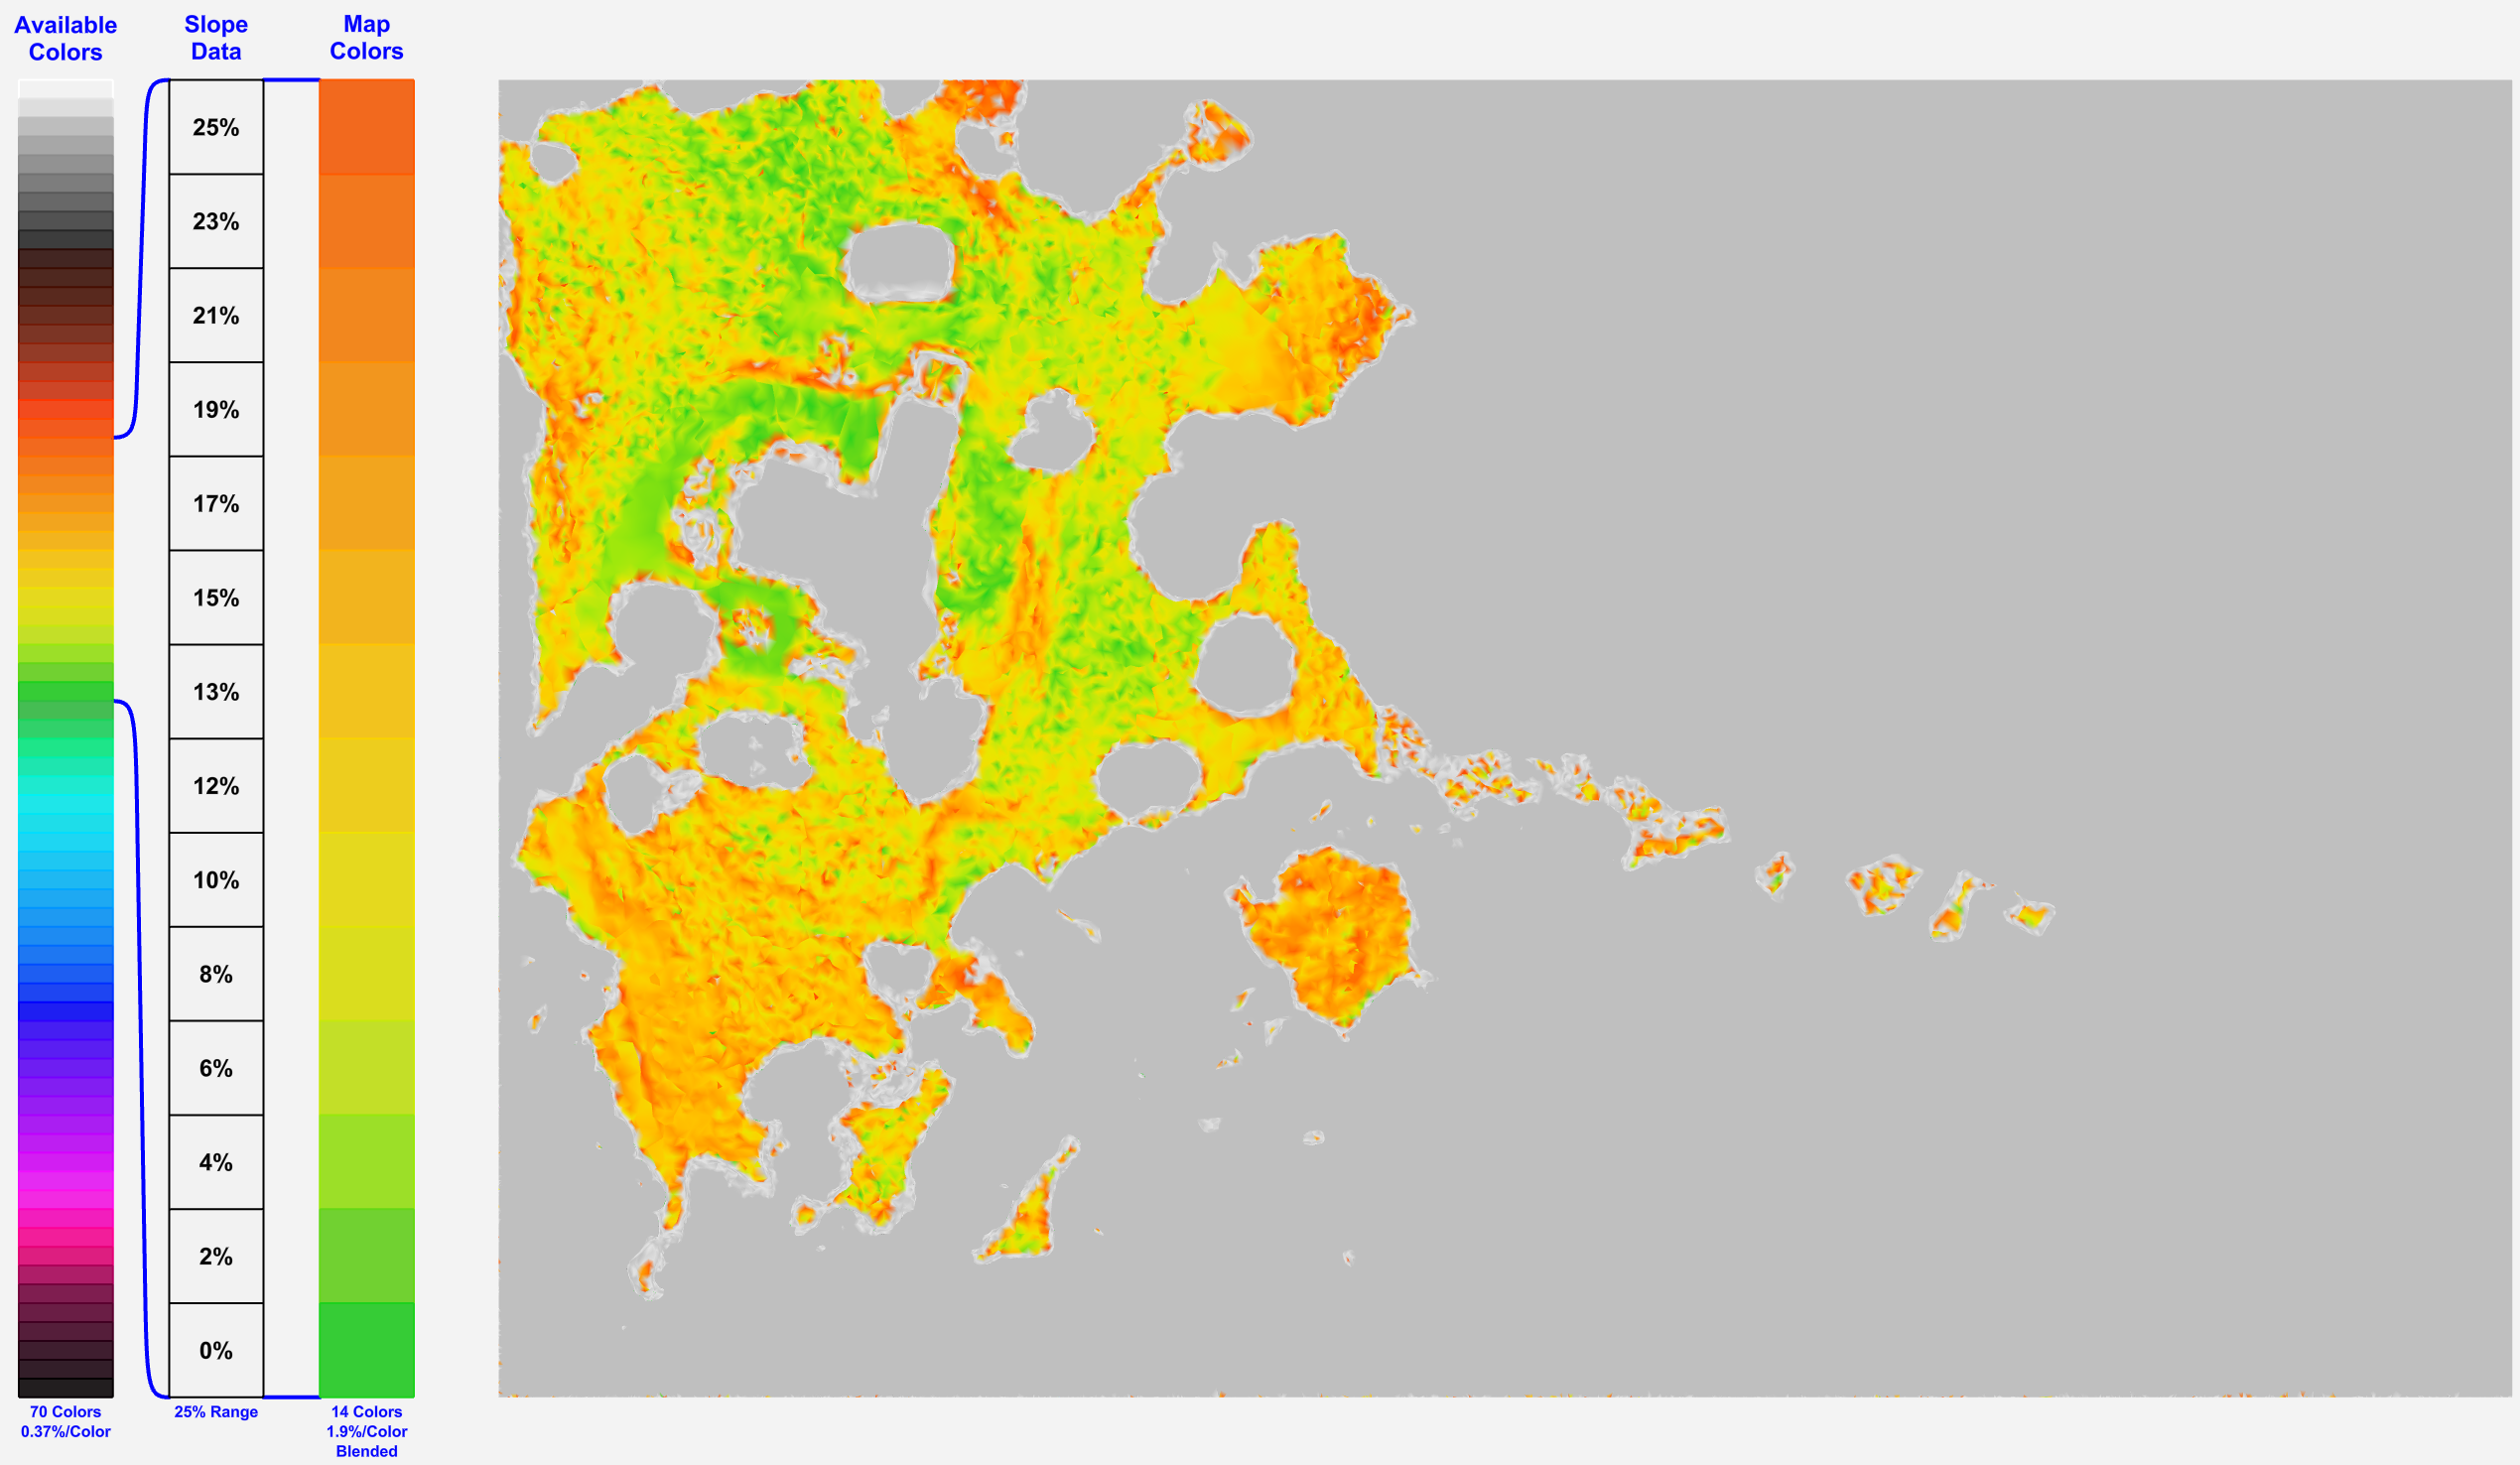
- There are too many colors spread over too wide of a region so the slopes of interest, 25% and less, do not have much definition.
I tackled the trees first. To eliminate them completely, I needed a way to shift the color of both their sides and top to a non-distracting neutral color. I could find no obvious way to do this using the slope data alone. Filtering out steep slopes could help on the sides of the tree but it would do nothing for their flattish tops. Then I got the idea of combining the conformal mapping technique I implemented for my elevation maps with steep-slope filtering. I used the conformal elevation to filter out the tall regions and give them a neutral color. This eliminate the tops of the trees and buildings. Indeed, steep-slope filtering combined with conformal-elevation filtering gave me a major improvement:
The buildings and trees are now mostly gone (only a bit of their edges remain). So next, the colors need to be crafted in order to bring out the details of the slopes of interest below 25%. So I added to the capability of my color designer, on the left of the plot, the ability to limit the color and slope range. Using just 14 colors, I got the next result:
The remaining issue is that the edges next to trees and buildings with slopes that exceed 25% are clamped to the maximum red color. These concentrated regions of bright red I find too distracting. To subdue these, I mapped regions with slopes greater than 25% to a neutral color. This resulted in another noticeable improvement:
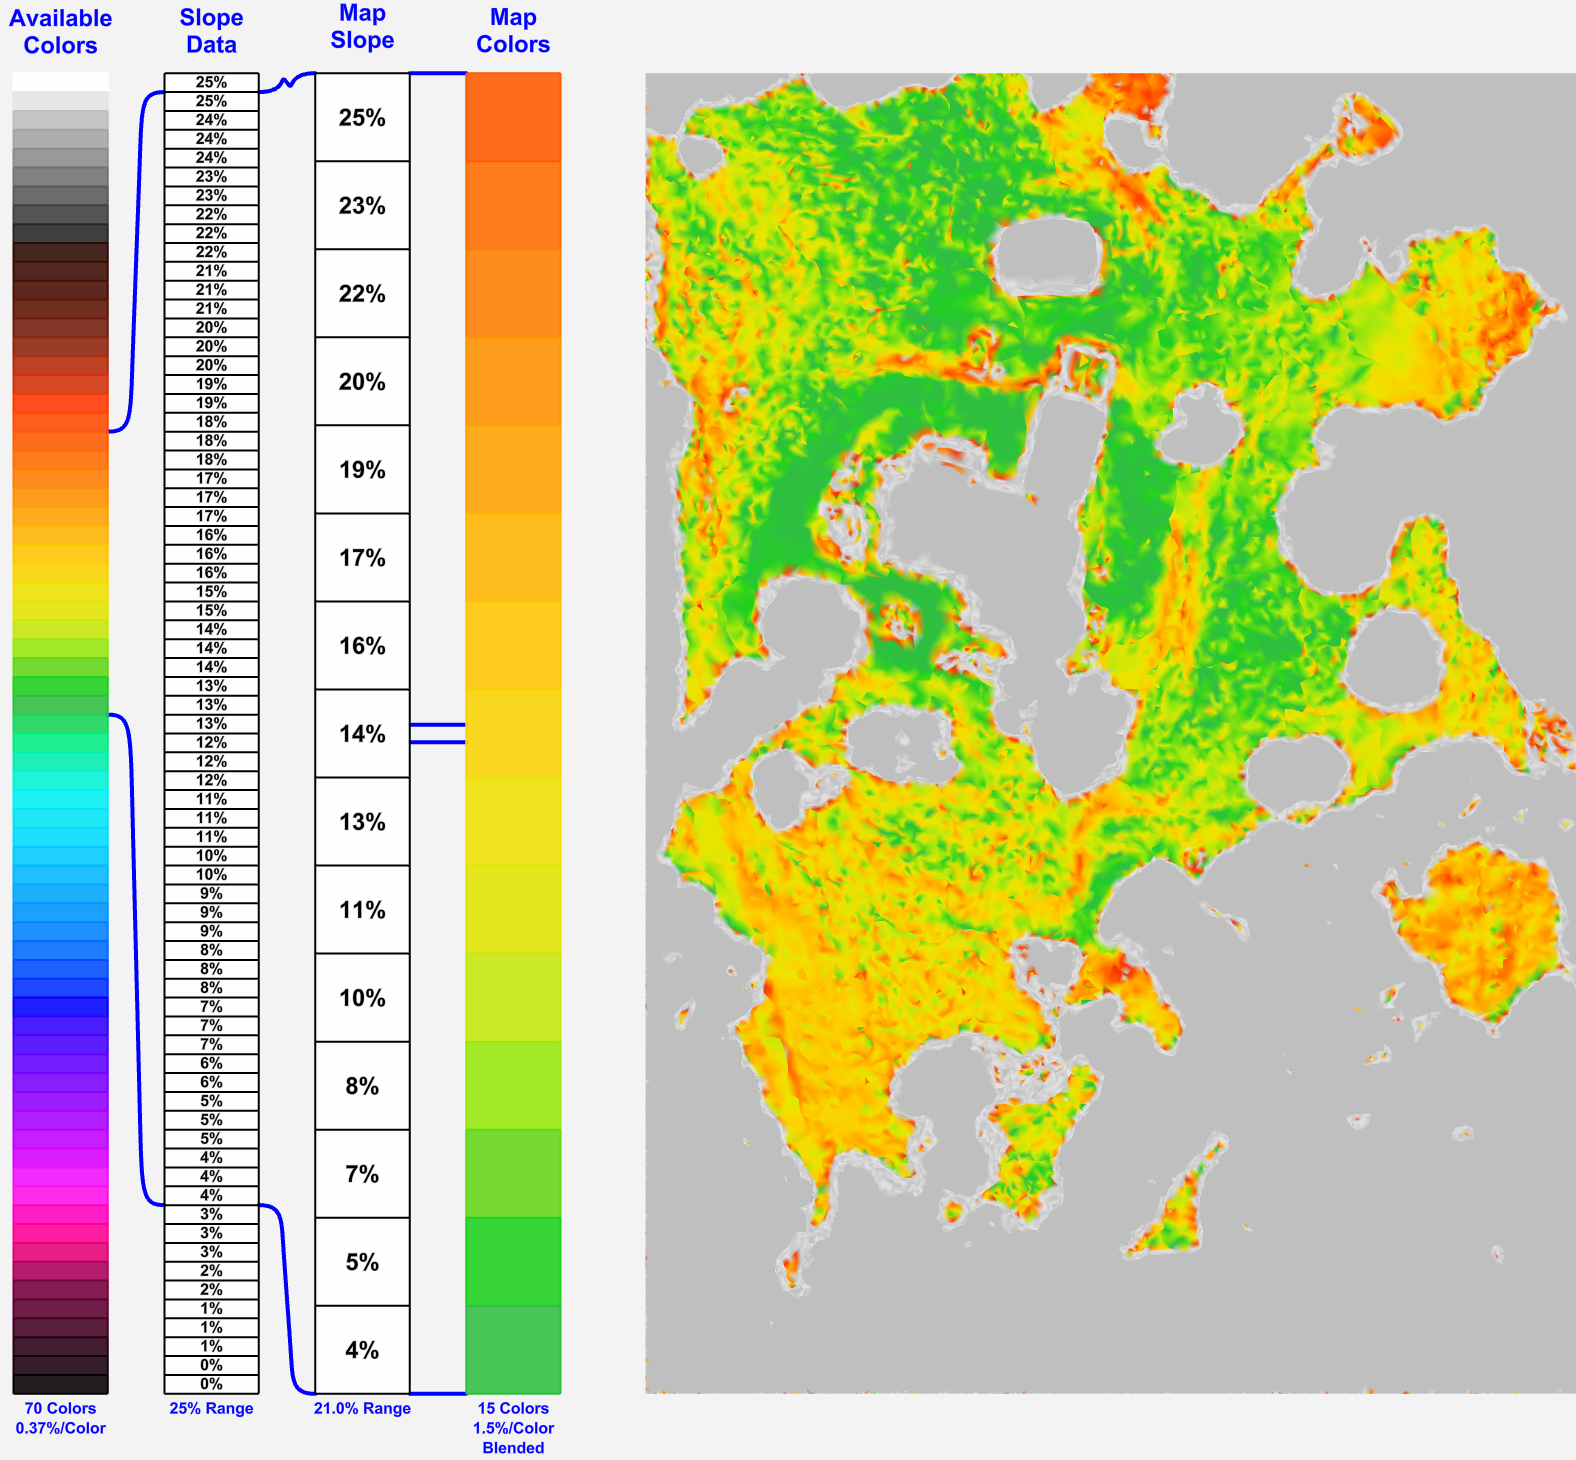
In order to provide more focus on slopes of greater safety concern, I bound the 14% slope to an orange shade and used 1.5%/color. This pulled up the bottom to 4%, a modest slope which is quite safe and now colored in green. The result is:
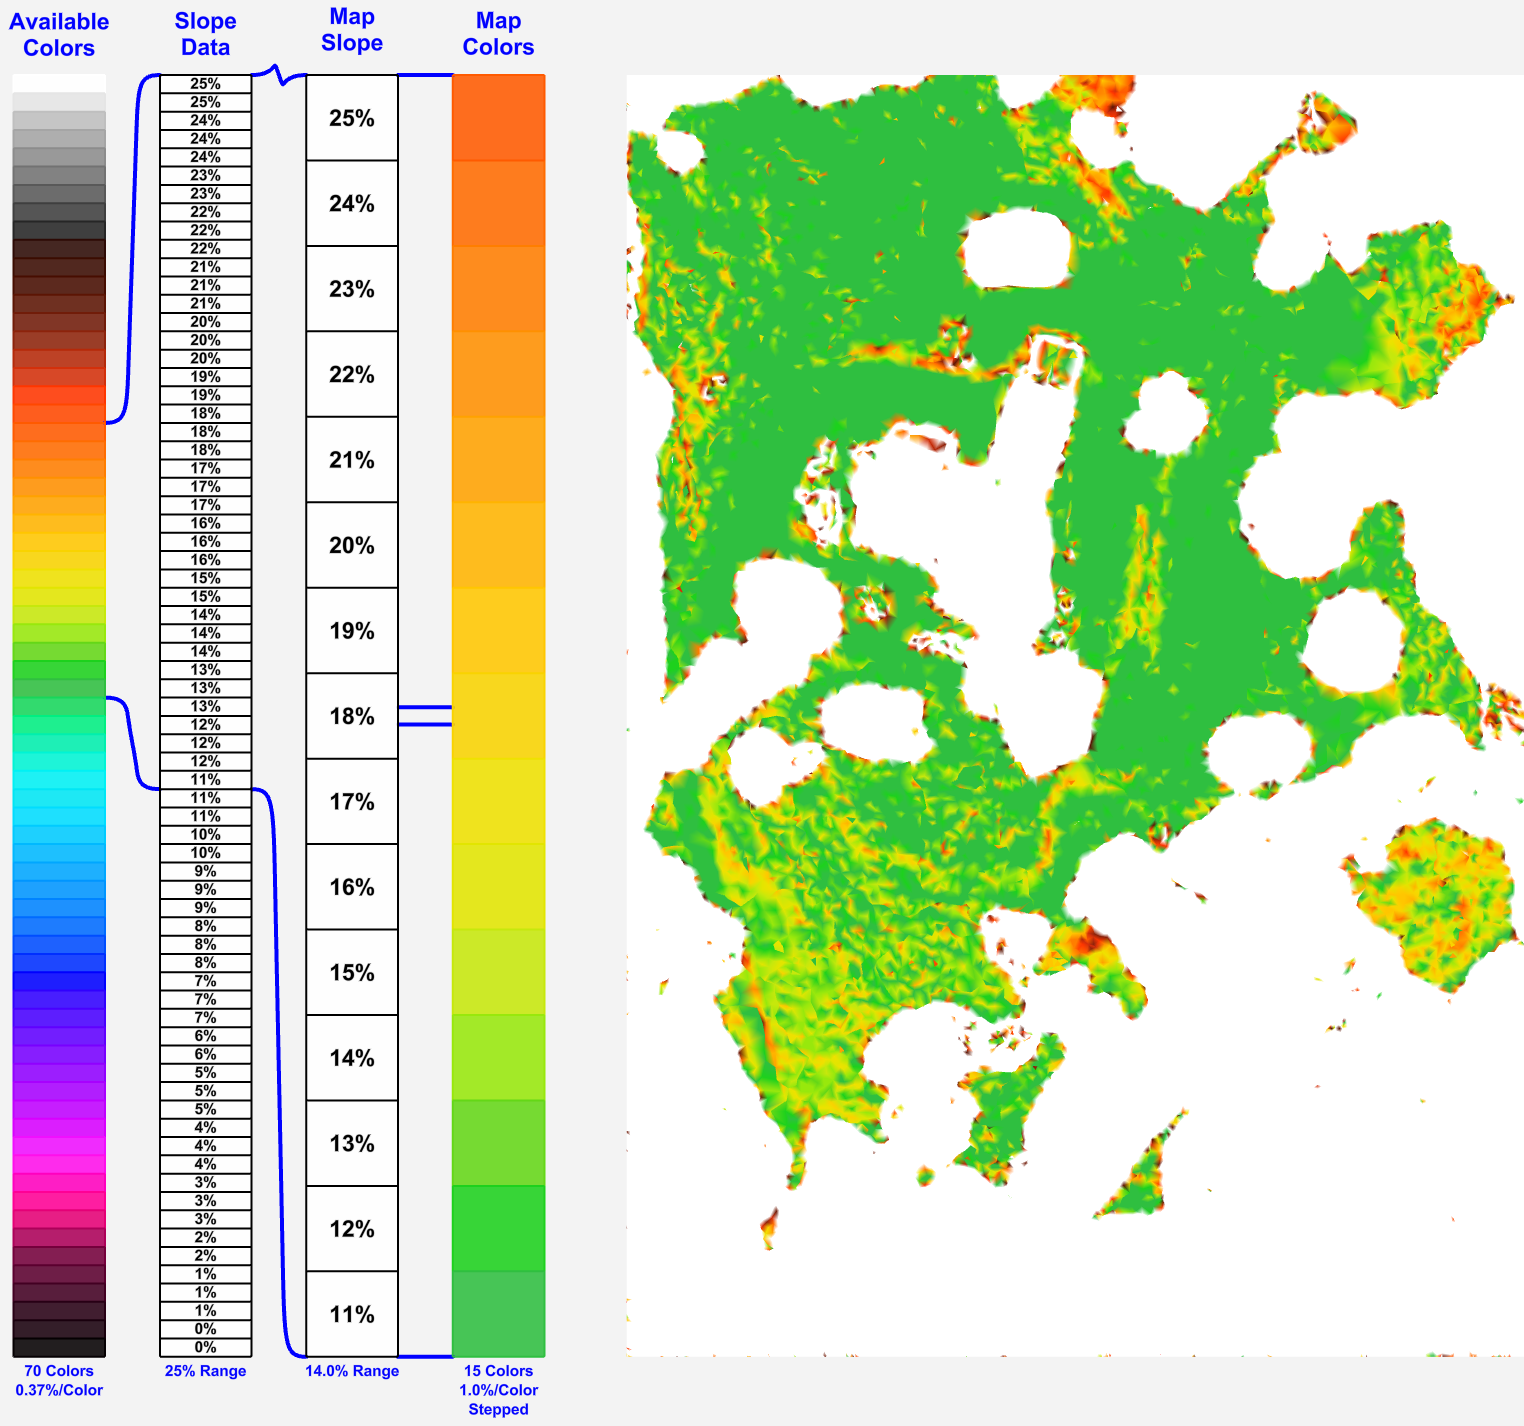
One final tweek I found was to use stepped rather than blended colors. This eliminate the final bit of fuzziness around the trees and buildings:
Then for those who like hillside shading in their maps, here is that result:
and this result can be viewed in 3D:
If only slopes over 10% are of concern, then the colors can be mapped to emphasize that region:
For those with different vision, a black and white version (with reversed colors) may be of interest:

The darker-orange to red regions on the prior map above and dark to black regions on this map were inspected and found to be quite dangerous. These areas could easily cause a tractor to overturn when driven cross-slope and have been made out-of-bounds for novice operators.
These maps were generated from a mission of 181 photos taken on 17 Dec. 2017, an overcast day with low wind, at a manually set 9 mph flight speed and an altitude of 300’ with a pattern of 1200’ E-W legs and short 70’ N-S legs at the turns. The RMSE of this mission was the best I have seen at 4.5’ (7.5’ X, 1.3’ Y, 1.4’ Z). I believe the low Y-contribution to the RMSE is due to the constant latitude on the long E-W legs. Likewise the X-contribution is likely bigger due to the constantly changing longitude on these legs.
A manual setting for the flight speed was used because the prior mission was ruined due to using fully automatic and default settings that allowed too high of a flight speed. This made every single photo very noticeably blurry in the direction of travel. Also all photos were quickly reviewed and any with very noticable bluriness were eliminated from the mission upload. This review resulted in the rejection of nearly all photos at the 20 turns of the mission.
In would be nice to see some of this capability in DroneDeploy. A key capability is the option to use a LiDAR bare-earth base in order to construct conformal elevation information. This has turned out to be valuable in multiple ways: (1) it enables both conformal elevation maps and (2) it provides an efficient way to filter out distracting tall elements when constructing a slope map.
In terms of colors, it would be great if the current, smallish implementation of color selection was enhanced to be physically bigger and to allow at least 5-degrees of freedom: (1) Selecting a subset of colors from the available colors (2) Selecting a subset of the data range (this is the only option currently available in DroneDeploy) (3) Binding of a color to a data value of key importance (like yellow to 14% slope or blue-green to 20’ elevation) (4) Reversal of the color order (5) With hillside shading or not. Another useful addition woul be the definition of the color to be used when overflow and underflow occurs.
And all maps should be viewable in 3D. Working with a 3D map introduces the opportunity for multi-dimensional control.
For example in my slope map, a neutral color could be chosen based upon 2 data (1) Slopes greater than 25% and (2) Elevations above 10’.
Interesting custom features would include re-definition of the available colors and the use of mathematical functions when mapping colors to data.
The above features are found in many existing tools and should be relatively easy to implement (compared to turning photos into 3D models). I would be happy to work with you to help develop these capabilities in any way that I can. Colors are what bring DroneDeploy data to life and there are so many great opportunities for improvement.
Contour maps are currently missing from within DroneDeploy. This is another area with a lot of room for growth. I think there are several interesting things that can be done once you have contours and conformal elevation data.
DroneDeploy is already great and in its coming 5th year we’ll see it get better and better.
Regards,
Terry.